





Observations
Contents
Not yet available to everyone – join the waitlist to get updates.
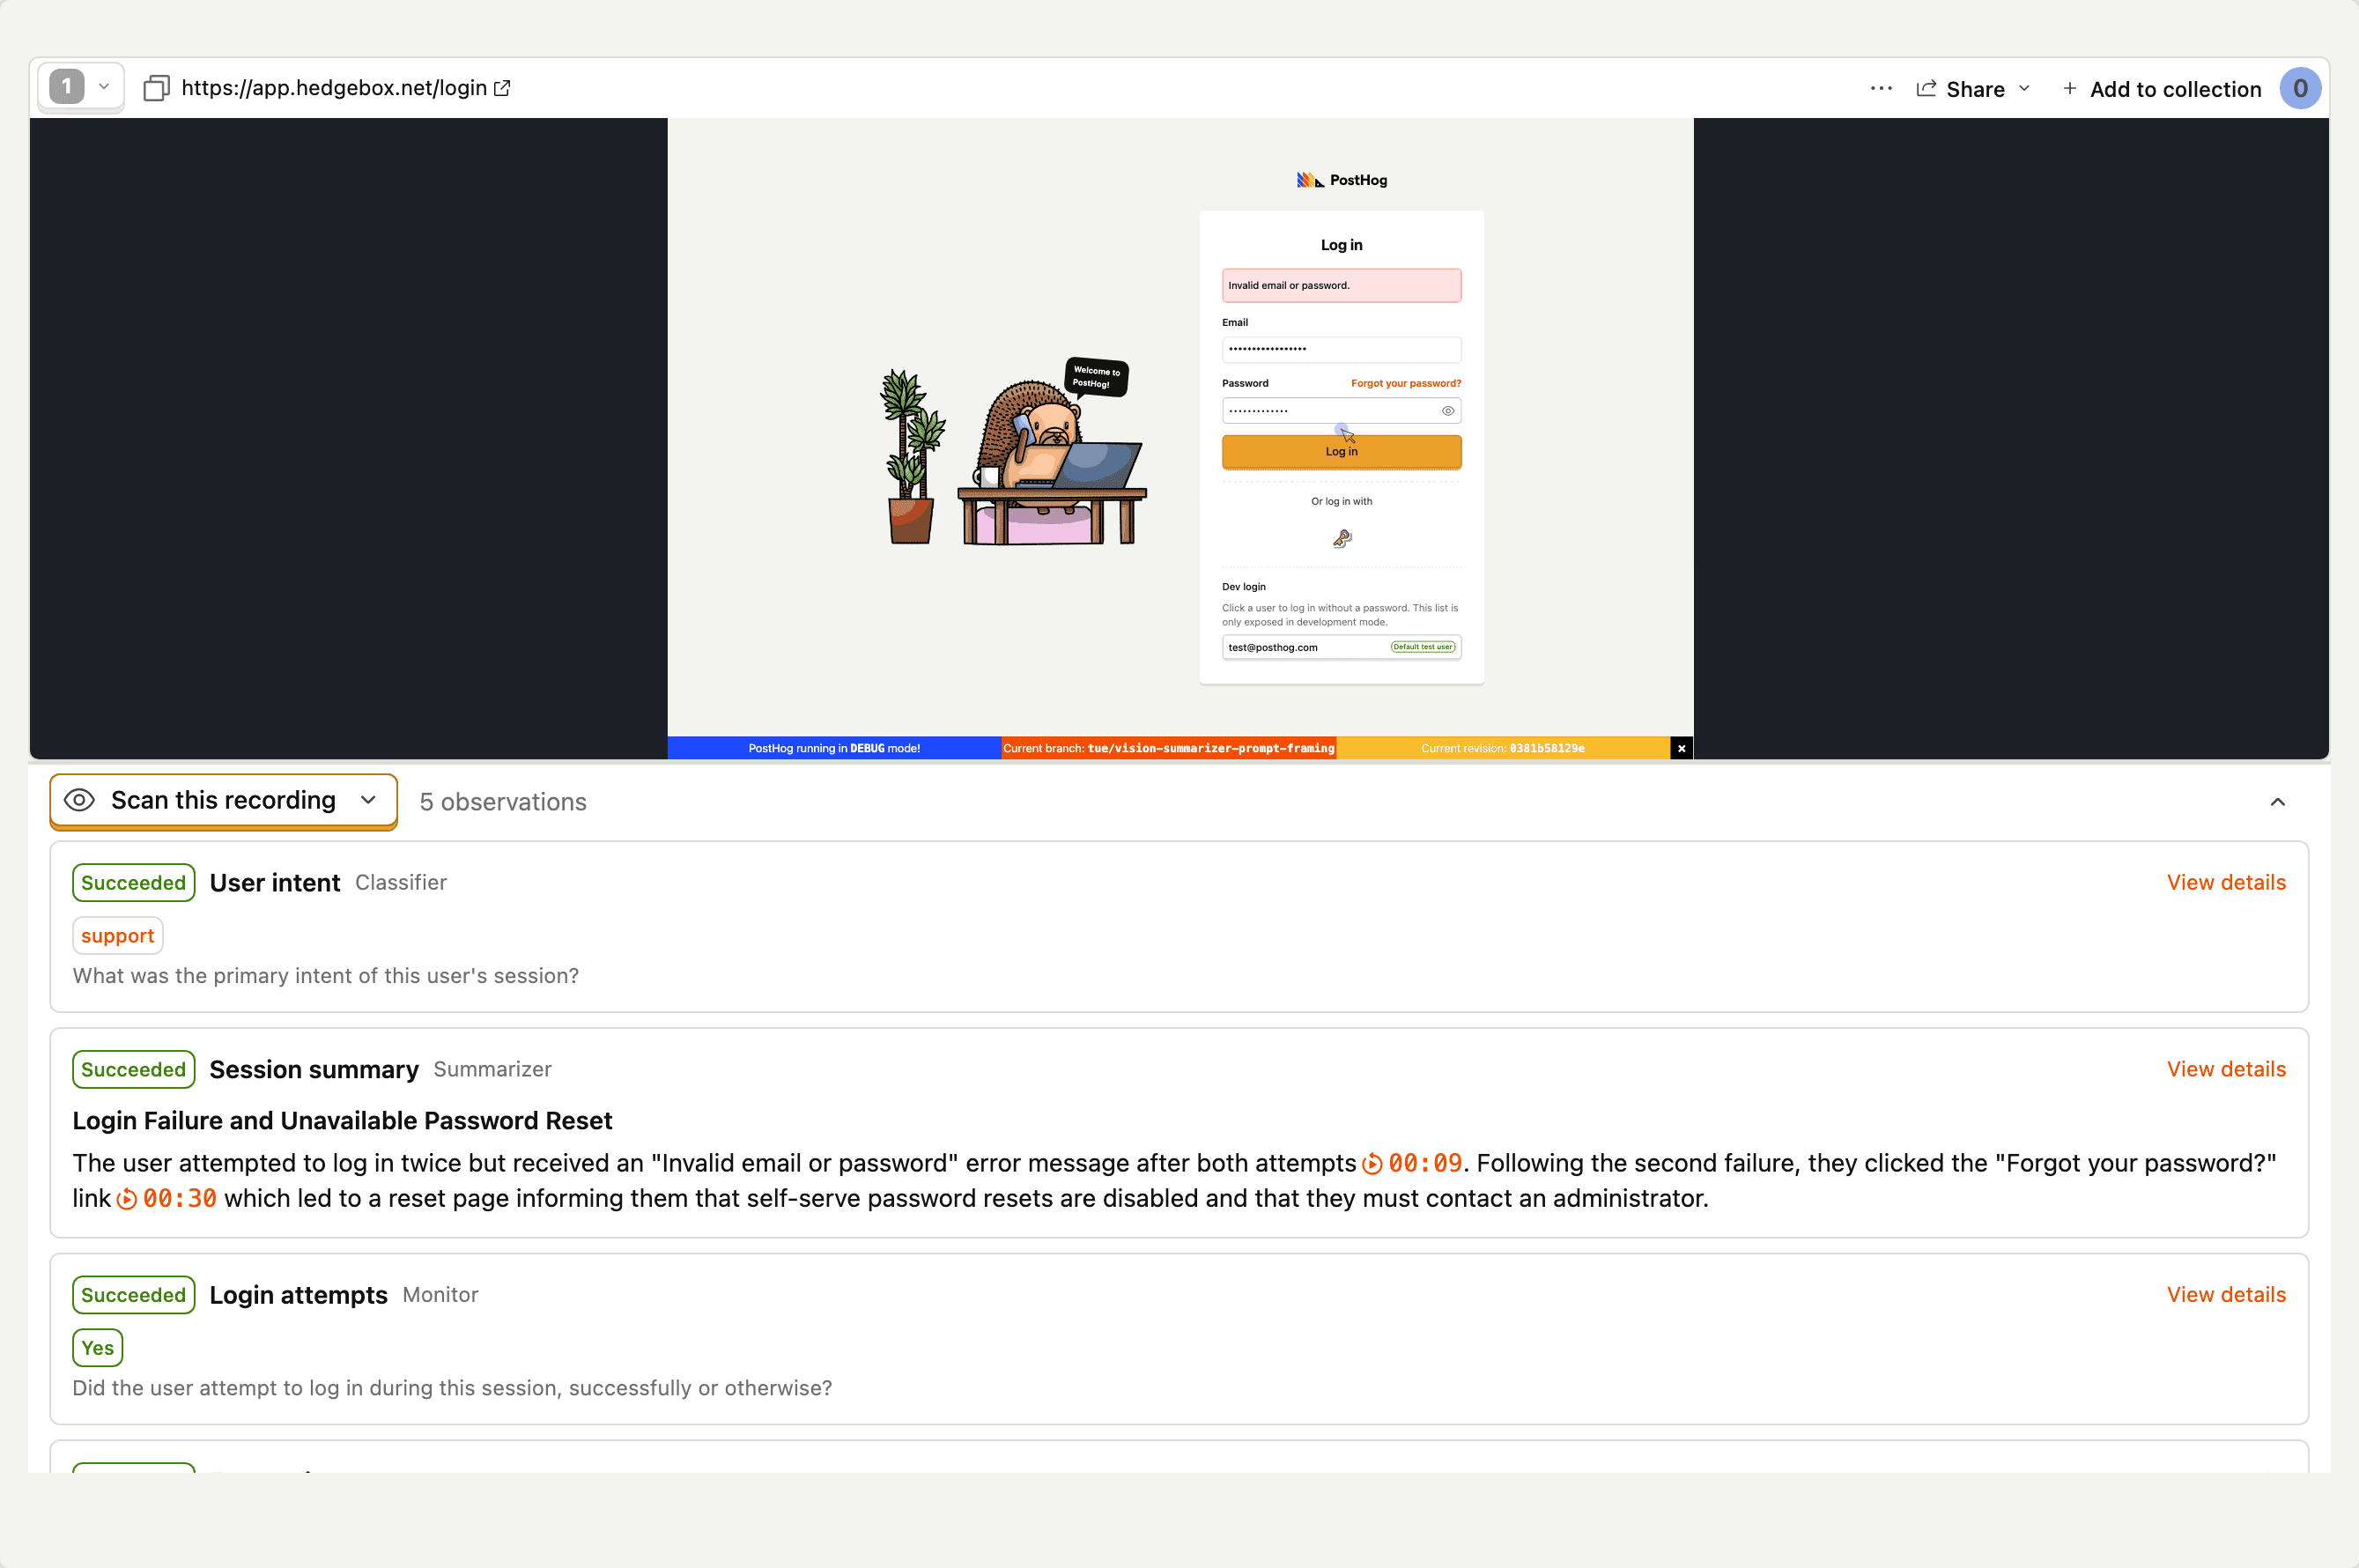
Each scanner has an Observations tab listing every observation it's produced. Click into one to open the detail view: the structured result, the model's reasoning (with clickable citations that jump the embedded player to the cited moment), and the prompt that produced it – frozen even if you've since edited the scanner.
Observations also surface in the replay player: the observations dock at the bottom of the player lists everything scanners have found about the session you're watching, and is where the Scan this recording action lives.
To judge whether the results are right – and improve the scanner from that judgment – rate observations on the scanner's quality tab.
Observations move through a small state machine:
pending → running → succeeded | failed | ineligible
succeeded– terminal. The structured result is saved and a$recording_observedevent is emitted.failed– terminal. The detail view shows an error reason. See troubleshooting for what each failure kind means.ineligible– terminal. The session can't be analyzed (no recording, too short, no events, etc.). Doesn't count against your quota. See running scanners.
Succeeded, pending, and running observations spend credits; failed and ineligible ones don't. A failed observation can be retried from its detail page (or from its card in the replay player), which replaces it with a fresh scan of the same recording.
Querying observations as events
Every successful observation is captured as a $recording_observed event in your project, so you can build insights, dashboards, and alerts on top of Replay Vision output using PostHog's SQL.
Event properties
| Property | Description |
|---|---|
scanner_name | Human-readable name of the scanner |
scanner_id | Scanner UUID |
scanner_type | monitor, classifier, scorer, or summarizer |
scanner_version | Version of the scanner config that produced this observation |
session_id | The recording that was observed |
recording_distinct_id | Distinct ID of the person in the recorded session (the subject, not whoever triggered the scan) |
recording_subject_email | Email of the recording subject at scan time, when known |
triggered_by | schedule (background sweep), on_demand, or retry (a re-run of a failed observation) |
triggered_by_user_id | The user who triggered an on-demand observation or retry; null for background sweeps |
model_used | The model that produced the result |
provider_used | The LLM provider behind model_used |
credits | What this observation cost, in credits (1 credit = $0.01), frozen at the price when it ran |
emits_signals | Whether the scanner was feeding findings into PostHog Signals when it ran |
scanner_output_confidence | The model's confidence (0.0 to 1.0) |
scanner_output_reasoning | Monitor, classifier, and scorer – the model's reasoning text, including any inline citations. Summarizers don't have a separate reasoning field |
scanner_output_verdict | Monitor only – "yes", "no", or "inconclusive" |
scanner_output_tags | Classifier only – the array of vocabulary tags assigned |
scanner_output_tags_freeform | Classifier only – tags outside the vocabulary, when the scanner allows them |
scanner_output_score | Scorer only – the numeric score |
scanner_output_title | Summarizer only – the generated one-line title |
scanner_output_summary | Summarizer only – the generated prose summary |
scanner_output_intent | Summarizer only – one sentence on what the user set out to do |
scanner_output_outcome | Summarizer only – one sentence on how the session ended |
scanner_output_friction_points | Summarizer only – array of named blockers or frustrations (empty if none) |
scanner_output_keywords | Summarizer only – array of lowercase keywords describing the session |
The timestamp on the event is the moment the observation completed, not the moment the underlying recording was captured.
SQL recipes
Monitor: count flagged sessions over time
Sessions a "Dead-end pages" monitor flagged yes, daily, over the last week:
Monitor: true rate (flagged / total)
The proportion of observed sessions a monitor flagged yes:
A gradually rising true rate is often a more useful early-warning signal than the absolute count.
Classifier: top tags
Most common intent tags from a classifier:
Scorer: distribution
Histogram of frustration scores:
For a percentile view:
Summarizer: recent summaries
Latest summaries from a summarizer scanner:
Summarizer: top friction points
Summarizers also emit a scanner_output_friction_points array naming the blockers and frustrations the user hit. Unnesting it gives you a ranked list of what's tripping people up:
Cross-scanner: spend by scanner
Each event carries a credits property with the observation's cost (1 credit = $0.01), so spend is just another query. This is the same data behind the Usage tab on the Replay Vision home:
Cross-scanner: filter only high-confidence verdicts
Confidence is self-reported, so this is a heuristic, not a guarantee – but it's often a useful filter for downstream automation.
Scanner impact and cohorts
Each scanner tracks its impact: how many sessions and users its findings affected over a trailing window (default 30 days). These counts appear on the scanner's Overview tab.
What counts as "affected" depends on the scanner type:
| Scanner type | What counts as affected |
|---|---|
| Monitor | Sessions where the verdict was yes |
| Classifier | Sessions tagged with a specific tag (tracked per-tag) |
| Scorer | Sessions scoring within a min_score and/or max_score threshold you specify |
| Summarizer | Not supported (narratives don't have categorical findings) |
Creating cohorts from scanner results
You can save a scanner's affected users as a static cohort with one click. The cohort is a snapshot at creation time and won't live-update as new observations come in.
For monitors, click Save as cohort in the impact panel. For classifiers, each tag has its own cohort button.
Cohort creation is capped at 10,000 users per request. If your scanner has more affected users, consider narrowing the trailing window or creating multiple cohorts over different time ranges.
Use these cohorts anywhere cohorts work in PostHog: funnel breakdowns, retention analysis, survey targeting, or experiment exclusion.
Wiring observations into the rest of PostHog
Insights and dashboards
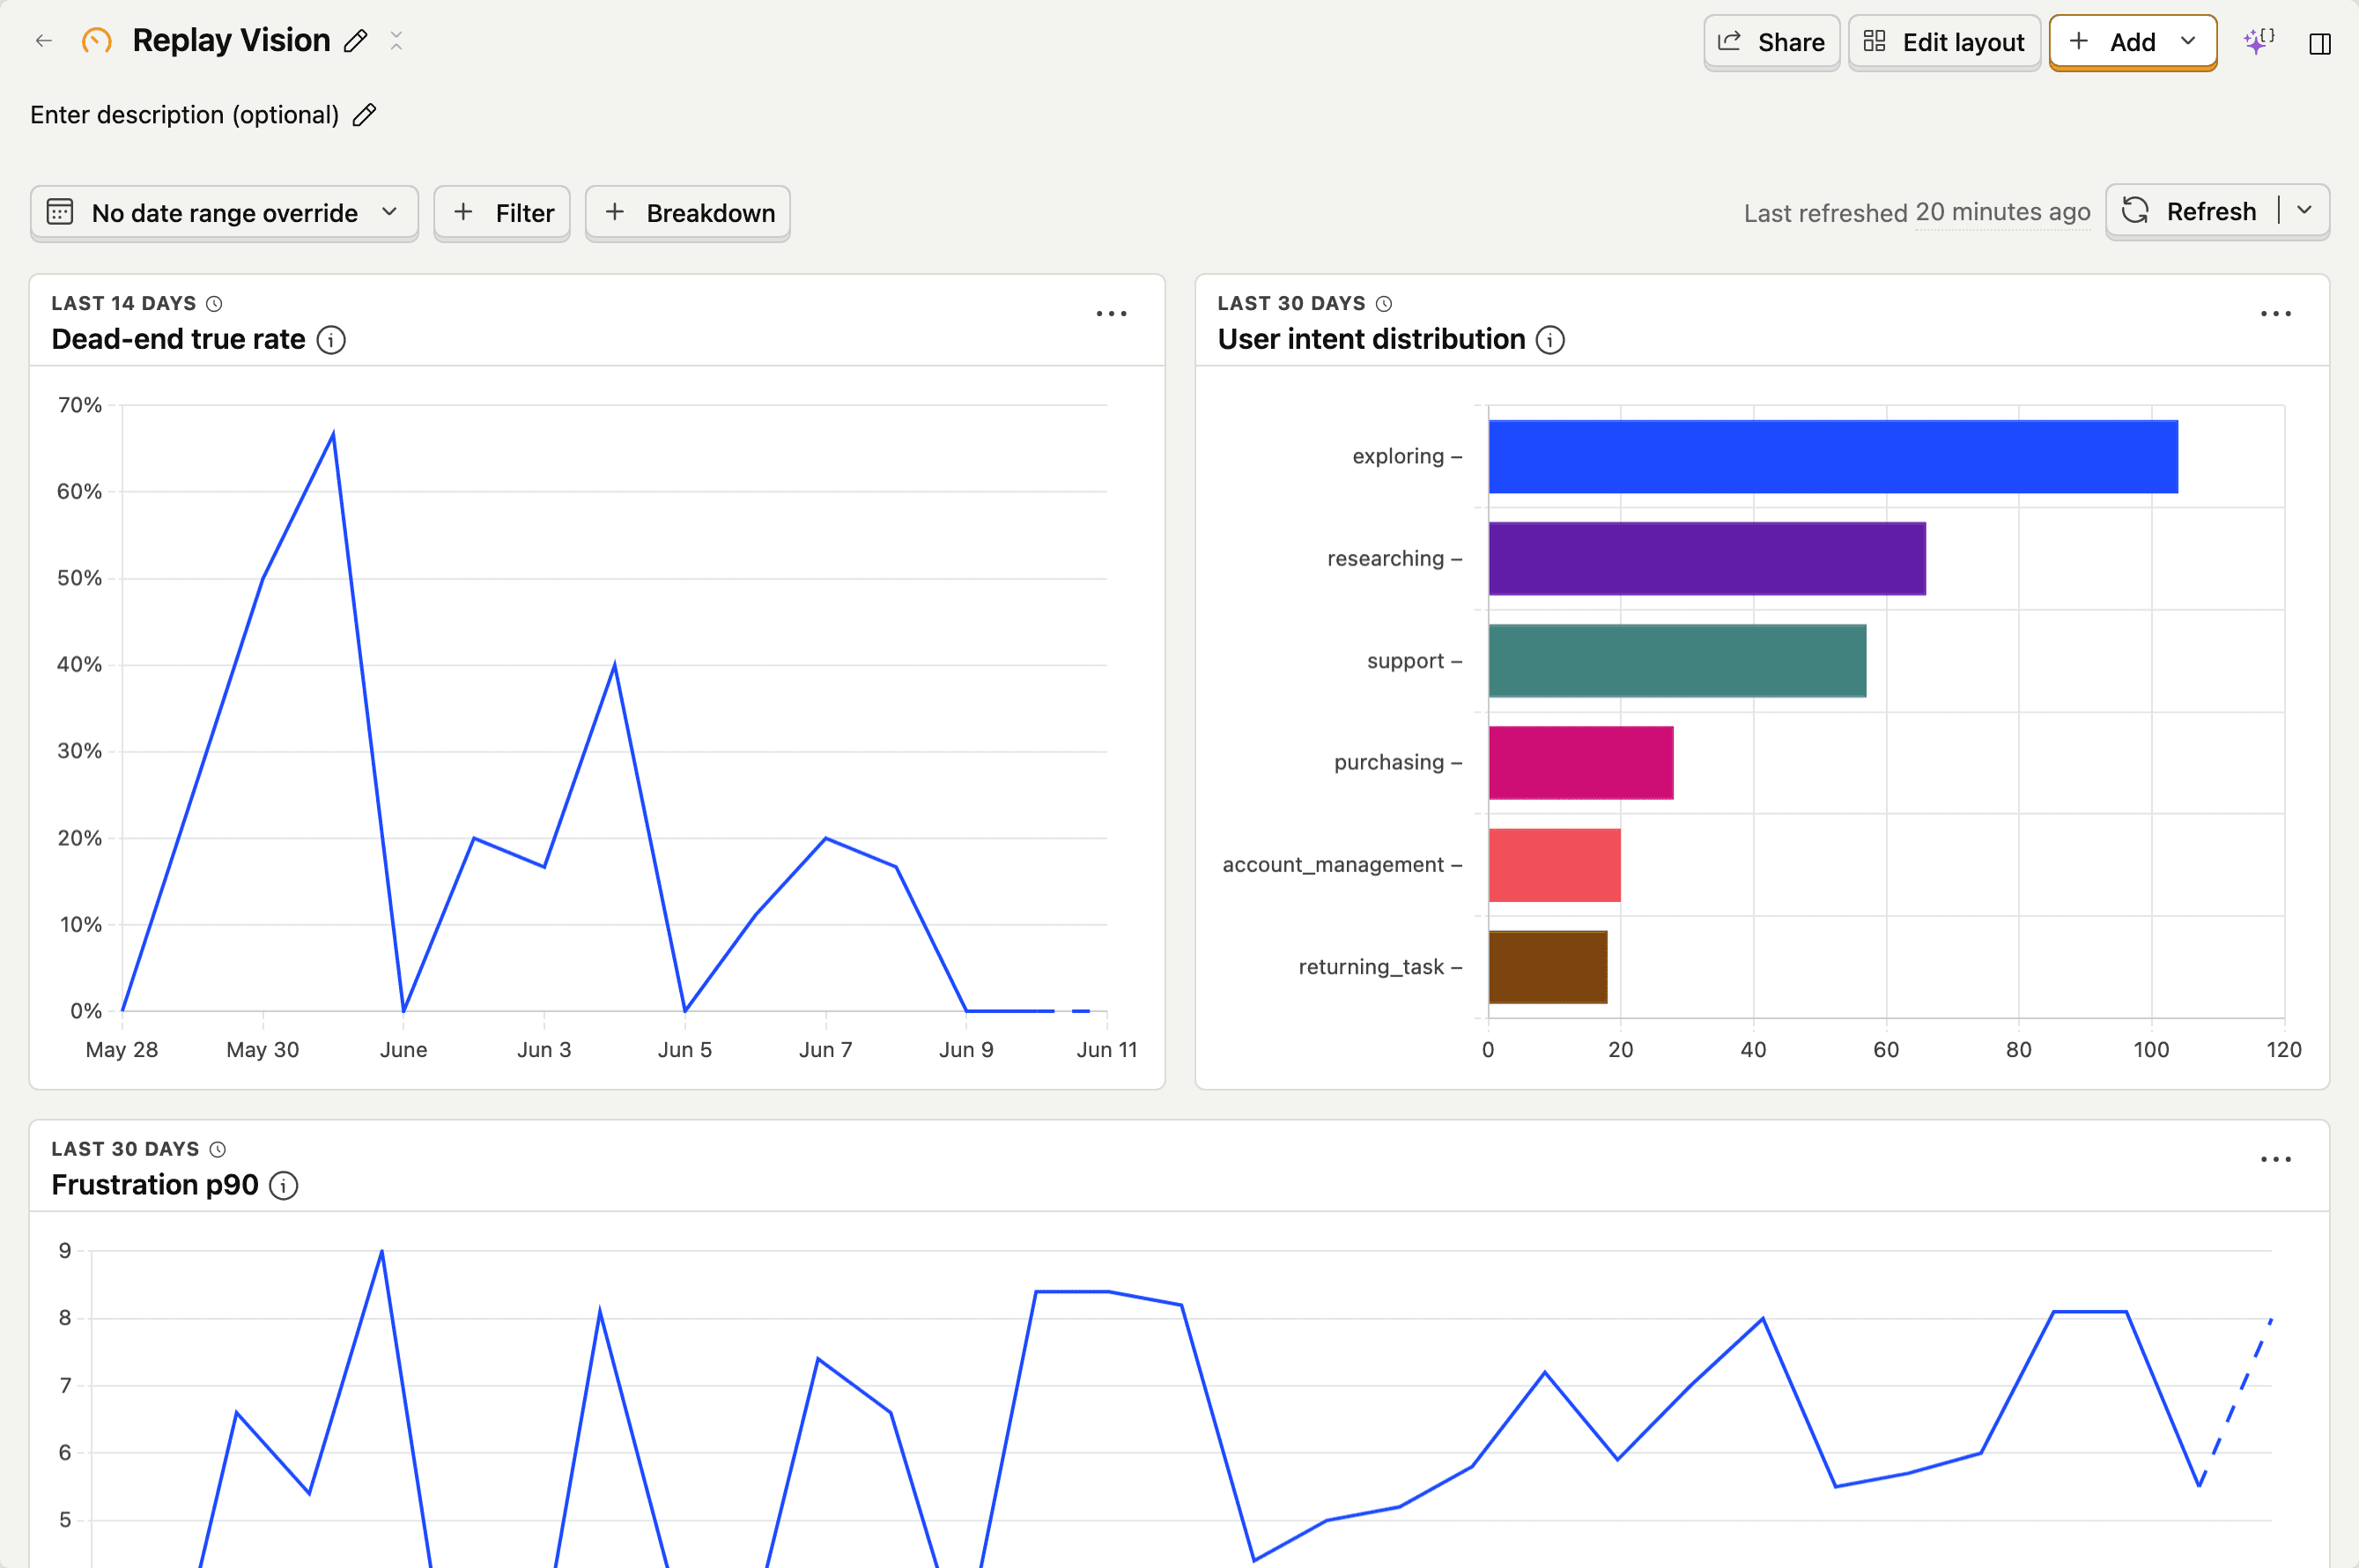
The recipes above all become insights by saving the query. From there they go on dashboards like any other insight.
Alerts
Alerts on an insight built from $recording_observed give you a notification when the metric crosses a threshold – e.g. "alert me when the dead-end true rate over the last hour exceeds 5%." If you'd rather get the finding itself – the AI narrative and links to the matching sessions – on a schedule or when a condition is met, use scanner digests and alerts instead.
Joining to other PostHog data
Because $recording_observed events live alongside everything else in your project, you can join them to anything – pageviews, custom events, person properties, cohorts. A useful pattern: find the events the user fired before the moment a monitor flagged them, grouped by URL.
The join is by session_id. From there it's the same SQL you'd write for any other event.